How to add Chart.JS to a React Component
Chart.JS is a charting tool that has all essential charts and it’s easy to implement.
Now that we have created a new React Component on the previous blog. We will now render a line chart using Chart.JS.
First thing that we’ll need to do is to install the Chart.JS dependency using npm commands:
npm i react-chartjs-2
npm install chart.js
Wait for the command to finish then go the component where you want to render the Chart.
Now import the Line Chart using the following code:
import { Line } from 'react-chartjs-2';On the Render function add the following code:
render() {
        var lineChartData = {
            labels: ['Red', 'Blue', 'Yellow', 'Green', 'Purple', 'Orange'],
            datasets: [{
                label: '# of Votes',
                data: [12, 19, 3, 5, 2, 3],
                backgroundColor: [
                    'rgba(255, 99, 132, 0.2)',
                    'rgba(54, 162, 235, 0.2)',
                    'rgba(255, 206, 86, 0.2)',
                    'rgba(75, 192, 192, 0.2)',
                    'rgba(153, 102, 255, 0.2)',
                    'rgba(255, 159, 64, 0.2)'
                ],
                borderColor: [
                    'rgba(255, 99, 132, 1)',
                    'rgba(54, 162, 235, 1)',
                    'rgba(255, 206, 86, 1)',
                    'rgba(75, 192, 192, 1)',
                    'rgba(153, 102, 255, 1)',
                    'rgba(255, 159, 64, 1)'
                ],
                borderWidth: 1
            }]
        };
        return (
            <div>
                <h1>Chart JS</h1>
                <Line data={lineChartData} />
            </div>
        );
    }
The lineChartData is the variable that contains the data for the chart.
<Line data={lineChartData} />Is the one responsible for rendering the chart on the component.
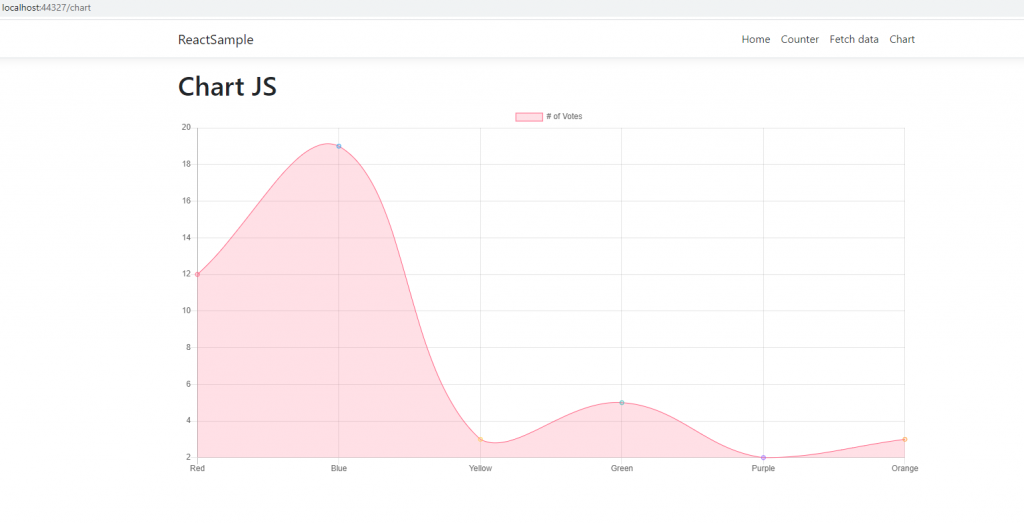
After setting up the chart on the component, we will now run the project and go to the end point of the component.
Now you will see that the chart renders on the component.

Now that we are able to render a line chart. We will discuss how we can render bar chart on the next blog.